Introduction:
Welcome to our latest blog post where we delve into the world of Accrual Schemes within Dynamics 365 Finance and Operations (D365FO). This topic is crucial for anyone involved in financial management, as understanding, and effectively utilizing accrual schemes is key to accurately representing a company's financial health. Today, we're excited to share a powerful trick that will not only simplify working with accruals in D365FO but also enhance your overall financial oversight. Let's get started!
Recent posts by Mads Bender
5 min read
Tips and Tricks for Accrual Schemes in D365FO

Topics: Finance D365FO
5 min read
Advancing Your Skills Best Practices and Trade-offs in DAX and M Query
.png)
Welcome back to a new Reporting Tuesday blog post, in this post we will dive deeper into Power BI's capabilities! After our introductory guide, this article focuses on enhancing your understanding of DAX and the strategic decisions between DAX and M Query. We’ll provide practical insights and applications for these concepts, aiming to boost your proficiency in Power BI. Enjoy!
Topics: DAX PowerBI Reporting tuesdays Reporting
2 min read
A Novice's Guide to DAX in Power BI
.png)
Introduction
Welcome back to a new Reporting Tuesday blog post. As a novice to the world of Power BI, one term you'll often encounter is DAX, or Data Analysis Expressions. This beginner-friendly guide will introduce you to DAX, explaining its importance and how it can transform your data analytics experience in Power BI. Enjoy!
Topics: DAX PowerBI Reporting tuesdays Reporting
6 min read
Application Lifecycle Management Described: Building Software is Like Building a House

Introduction:
Topics: D365FO D365 Commerce D365 Supply Chain Management ALM
3 min read
Advanced Data Transformation Techniques in Power BI
.png)
Welcome to another Reporting Tuesday blog post! Are you ready to unlock the full potential of Power BI with advanced data transformation techniques? Whether you're an intermediate user or on your way to becoming an advanced one, this article is tailored for you. Let's dive into the heart of effective reporting and analysis in Power BI.
Topics: D365FO PowerBI Reporting tuesdays Reporting
4 min read
Exploring Parameterized Queries in Power BI

Welcome back to another informative installment of our Reporting Tuesday blog posts. In this article, we will delve into the world of Parameterized Queries in Power BI. Parameterized queries are an exciting and potent feature that empowers you to create more adaptable and dynamic reports. By utilizing parameters to control the data loaded into your report, you can enhance the flexibility of your reporting while simplifying data manipulation during the loading process. Furthermore, this flexibility can, with the proper prerequisites, be extended to end-users, enabling them to slice and customize data according to their needs. In this article, we will break down what parameterized queries are, how to use them effectively, and why they are invaluable. Enjoy the exploration!
Topics: PowerBI Reporting tuesdays
5 min read
Basic Data Transformation Techniques in Power BI

Welcome back to another installment of our Reporting Tuesday blog posts. In this article, we will delve into the fundamental Data Transformation Techniques in Power BI. This exciting journey will enable you to harness Power BI's capabilities to transform and visualize your data effectively. To create powerful and insightful reports and dashboards, you often need to clean and shape your data to make it suitable for analysis. In this piece, we will explore some essential data transformation techniques in Power BI to help you get started on this enriching journey. Enjoy!
Topics: PowerBI Reporting tuesdays
4 min read
Exploring the New FinancialReportVisual in Power BI for BPA

In this article, we're excited to introduce you to the latest addition to Power BI within Business Performance Analytics (BPA). This new visual, called FinancialReportVisual, is a matrix visualization that show promise to be a powerful tool for both reporting and in-depth exploration of financial data. Let's dive into the details and functionalities of this visual.
Topics: D365FO BPA Business Performance Analytics Reporting tuesdays
3 min read
Exploring Business Performance Analytics (BPA) in D365FO
In this post, we will delve into the intriguing realm of Business Performance Analytics (BPA), a promising new feature that holds the potential to revolutionize reporting within D365FO. BPA aims to provide profound insights into various business processes, all within the confines of D365FO. Microsoft has intelligently transformed the application's data into an intuitive dimensional data model, promising an enriching experience for users.
Topics: D365FO BPA Business Performance Analytics Reporting tuesdays
2 min read
A quick introduction to Microsoft Fabric
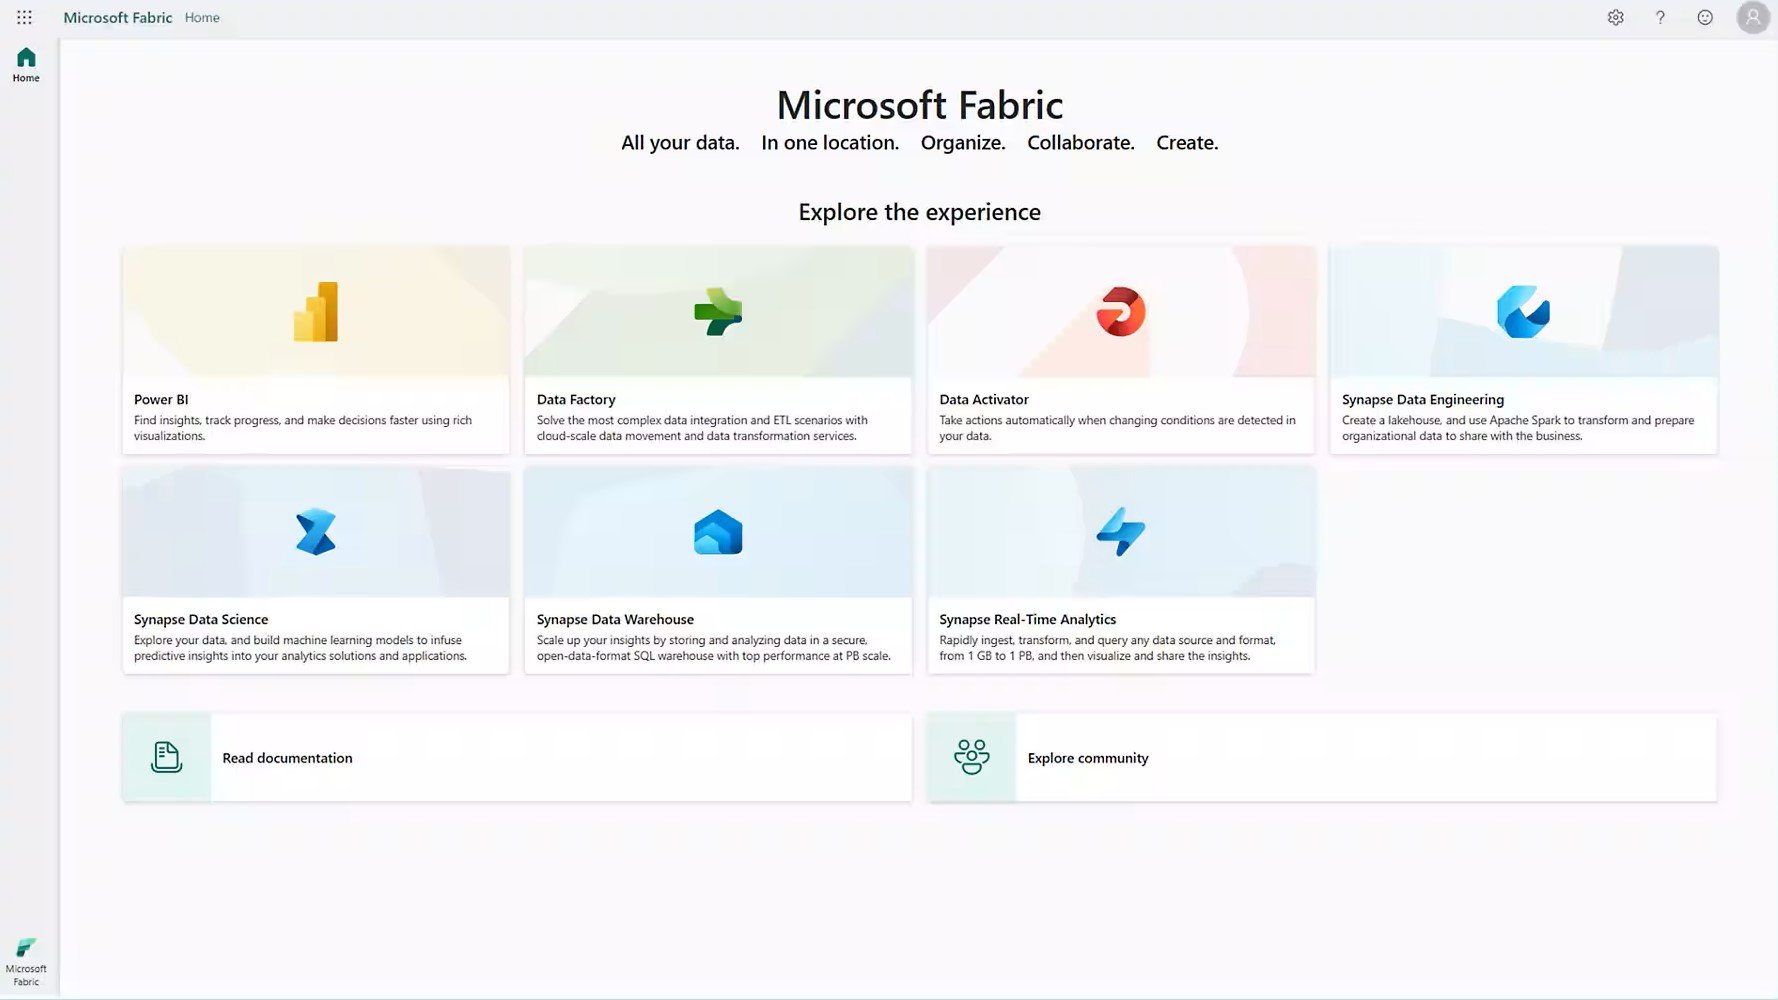
Welcome back to a new Reporting Tuesday blog post, where we explore Microsoft Fabric—a platform that has the potential to take your data processing to the next level.