
In this article, we're excited to introduce you to the latest addition to Power BI within Business Performance Analytics (BPA). This new visual, called FinancialReportVisual, is a matrix visualization that show promise to be a powerful tool for both reporting and in-depth exploration of financial data. Let's dive into the details and functionalities of this visual.
Understanding the FinancialReportVisual: FinancialReportVisual is exclusively available within the Power BI embedded in Business Performance Analytics. As of the current state, users must have access to Business Performance Analytics to utilize its capabilities.
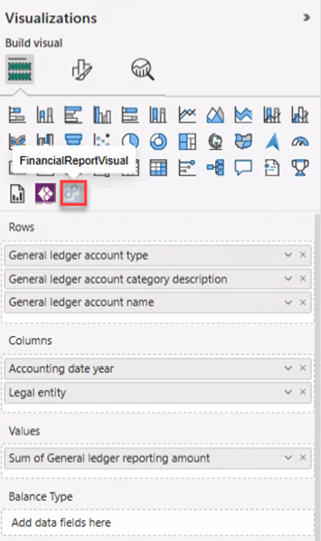
The Elements of FinancialReportVisual: Upon encountering the FinancialReportVisual, you'll notice four integral components. Here, we outline the order in which they will be populated if you select values from your dataset without dragging and dropping:
-
Values: This section represents the value aspect of your matrix. In most financial reports, this corresponds to the monetary amount.
-
Rows: The second value you choose will be assigned to the Rows section. Any additional values selected while values, rows, and columns are populated will also be allocated to rows.
-
Columns: The third value you select will populate the Columns section. Should you wish to add more values to columns, a simple drag-and-drop operation will achieve that.
-
Balance Type: Currently, there is limited clarity on this aspect. It could still be in development, or specific data formats might be required. Documentation for this feature is not available at the moment.
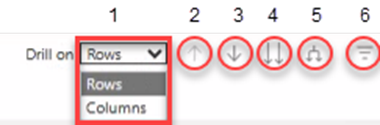
Interacting with FinancialReportVisual: The visual boasts a range of controls located at the top:
-
Drill On: This control allows you to specify whether you want to drill on Rows or Columns when both contain multiple values.
-
Drill Up: When you've drilled down into details, this arrow facilitates a return to the previous level, respecting the chosen dimension (Rows | Columns).
-
Drill Mode: Enabling this mode permits users to click on specific data points for detailed insights. This disregards your drill-on setting, drilling into row or column specifics based on where you click.
-
Go to Next Level: This option drills further into the hierarchy based on the chosen value in Drill On, without displaying previous levels.
-
Expand All Down on Level: Similar to the previous option, this drills deeper into the hierarchy, also revealing parent values, which helps segment data for a clearer view.
-
Filter on Visual: The filters on the visual.
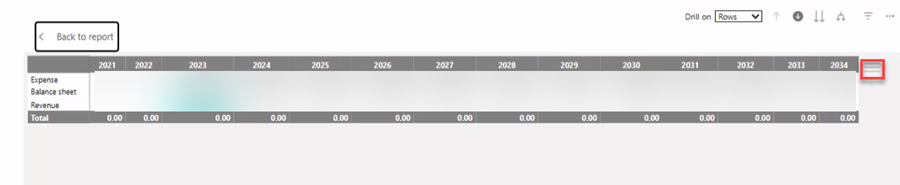
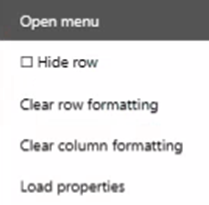
Customization and Enhancement: A new menu option enriches the visual's capabilities. Accessible by right-clicking or through the upper right corner, this menu empowers you to:
-
Customize rows, columns, and measures.
-
Undo customizations and unhide hidden rows and columns.
-
Tailor data presentation based on specific requirements.
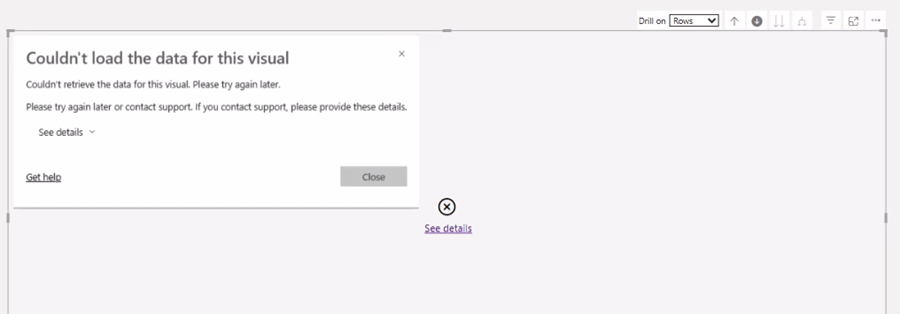
The Path Forward: This is just the beginning of what FinancialReportVisual has to offer. While there might be some hiccups in the current version, its potential for transforming reporting and data exploration is evident. Aspects like drilling up could be refined for smoother navigation. Occasional errors remind us to save regularly.
Despite its early stage, FinancialReportVisual already holds the promise of enhancing flexibility in reporting and driving insightful analysis. While it might not yet surpass D365's Financial Reporter from a user perspective, its agility in setup, layout changes, and updates positions BPA as a prosperous contender. It facilitates instant drill-ins into ledger journals, empowering dynamic slicing and dicing across financial dimensions. Swiftly, you'll be submerged in data, extracting insights, and adding parameters for in-depth analysis.
Stay tuned for more updates as this tool matures, and Microsoft continues to enhance its functionalities. Rest assured, Business Performance Analytics is shaping up to be a game-changer in the world of financial reporting and analysis.
This concludes this examination of FinancialReportVisual and Business Performance Analytics. Do not hesitate to contact us if you want to know more about BPA or need assistance in evaluating if BPA is something for you and setting it up.