
Welcome back to another installment of our Reporting Tuesday blog posts. In this article, we will delve into the fundamental Data Transformation Techniques in Power BI. This exciting journey will enable you to harness Power BI's capabilities to transform and visualize your data effectively. To create powerful and insightful reports and dashboards, you often need to clean and shape your data to make it suitable for analysis. In this piece, we will explore some essential data transformation techniques in Power BI to help you get started on this enriching journey. Enjoy!
Data Source Connection:
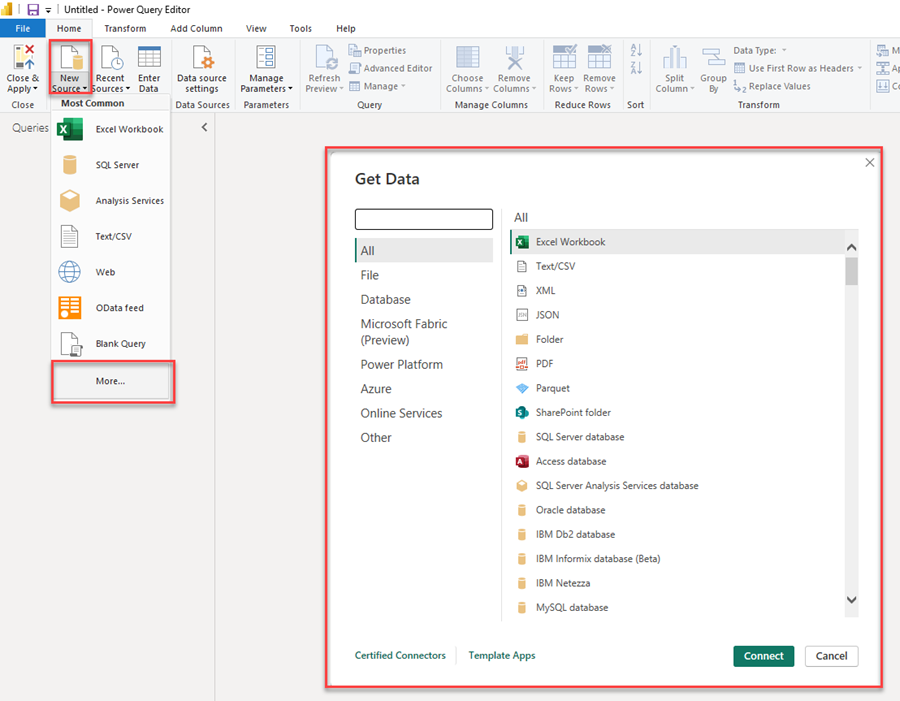
Our first topic is Data Source Connection. While you may already be familiar with this, it remains at the core of reporting. Initiate the process by connecting to your data source, which encompasses a wide range of options, including databases, Excel files, web services, and more. Power BI's intuitive interface simplifies the establishment of these connections.
Data Cleaning:
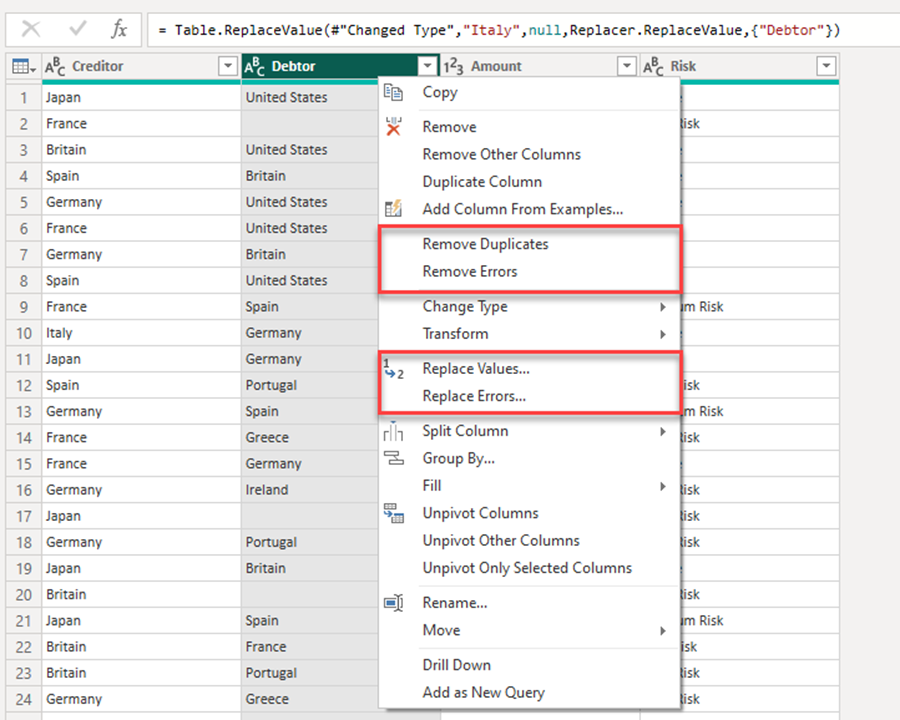
Data cleaning stands as an essential step in working with data, as it often arrives with inconsistencies, missing values, and errors. Some fundamental functionalities you should master in Power BI for data cleaning include removing duplicates, filling in missing values, and correcting data types.
Column Renaming:
Column renaming can be a cumbersome task, but it can significantly enhance the clarity of your reports. In Power Query Editor, rename columns to make them more comprehensible. Simply right-click on a column header and select "Rename..." (Refer to the image above for guidance).
Data Type Conversion:
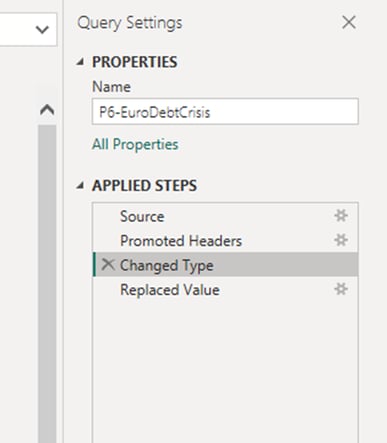
Power BI generally does a commendable job of recognizing data types during the initial data source load. However, in cases where this information is incorrect, it is advisable to navigate to the "Change Type" option in your Change Pane, located on the rightmost side of the screen. Ensure you are at this step and update any incorrect data types. This is especially crucial if you have numeric fields that should be text-based, such as when you need to retain leading zeros. Use the "Change Type" feature in Power Query Editor to convert columns to the appropriate data types, like changing a text column to a date.
Filtering Data:
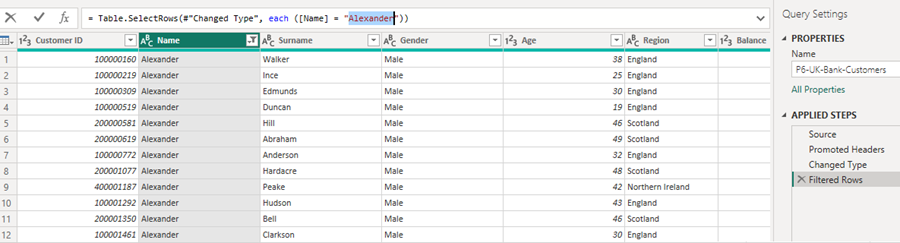
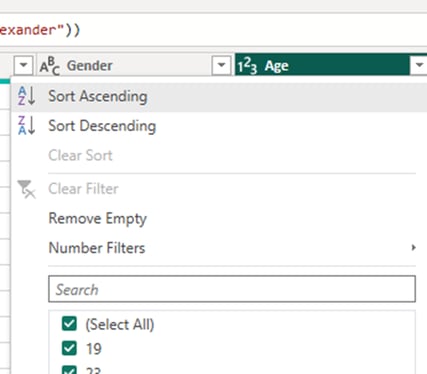
Remove unnecessary rows or filter data based on specific criteria. Apply filters to select the relevant data for your analysis. This is particularly valuable when dealing with large datasets, where you may only be interested in specific data subsets. Additionally, when working with extensive datasets, you may not immediately see the desired filter, especially when filtering for specific values. In such cases, it can be advantageous to select a value first and then subsequently refine it to your specific criteria within the formula.
Sorting Data:
Arrange data in ascending or descending order to enhance readability and analysis. You can sort columns by clicking the dropdown menu for the specific column and choosing "Sort Ascending" or "Sort Descending."
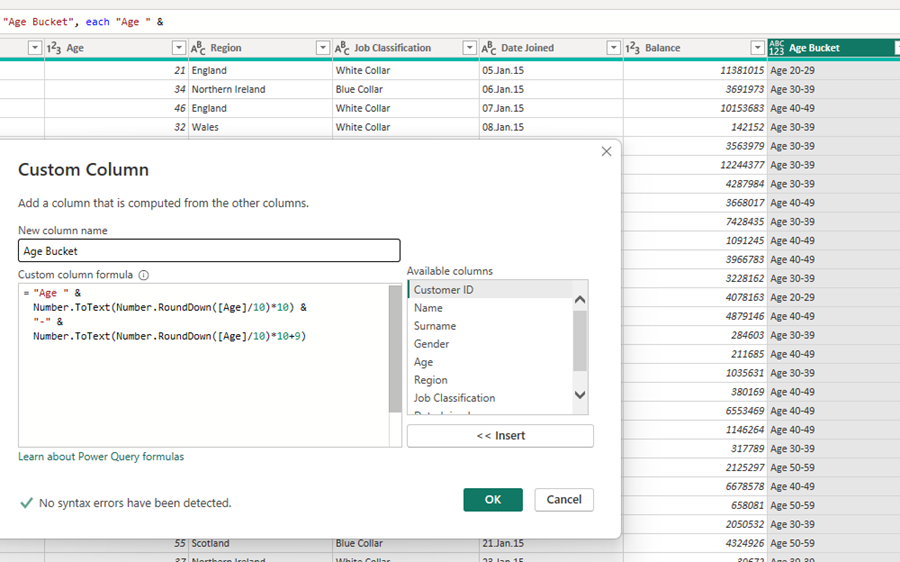
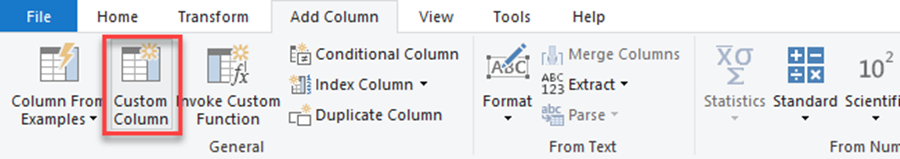
Adding Custom Columns:
Create new columns based on existing data using Power Query's "Add Column" feature. This is especially useful for calculated columns or for merging data from multiple columns. This feature will quickly become one of your most frequently used tools for data transformation. It's essential to consider when and where to use this; sometimes, creating measures instead of columns may be more advantageous. Below is an example that demonstrates how to segment your data into age buckets.
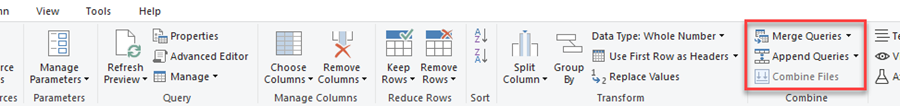
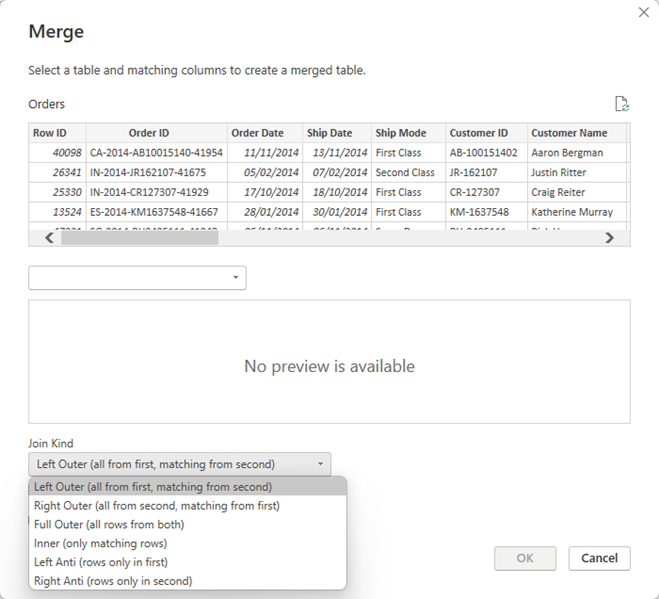
Merging Queries:
Combine data from multiple sources or tables through query merging. Power BI offers various join types, such as inner join and left outer join, among others. It's crucial to assess whether your goal can be achieved through your data model, as this can help reduce the data load on your report. However, it's not always possible to achieve the desired result solely through data modeling. Merging and appending data is a straightforward process. One thing to note is that sometimes you must create a new query for the merge to be executed correctly. Also, if you intend to append queries, ensure that the columns have the same naming conventions.
Aggregating Data:
Group data by specific columns and perform aggregations like sum, average, or count using the "Group By" function. This is particularly useful for summarizing data. You can access the "Group By" feature either in the Ribbon or by right-clicking on a column. If you need to group by multiple columns, either highlight all of them or add them to your grouping in the pop-up window.
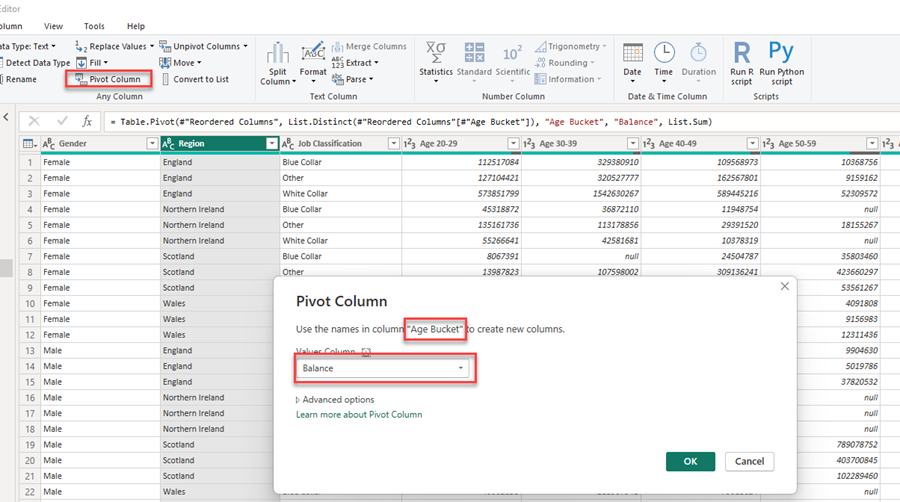
Pivot and Unpivot:
Reshape your data using the "Pivot" and "Unpivot" transformations. Pivot allows you to convert columns into rows, while Unpivot accomplishes the reverse. To pivot, select the column you want to use for column headers and press the pivot option in the Ribbon under the Transform Tab. In the pop-up window, select the column you want to use for values. All other columns will remain as they are. To unpivot, select all the columns you want to transform from pivot to row structure. This process will create two columns: "Attribute" with the column header and "Value."
Conclusion:
This concludes our exploration of basic data transformation in Power BI. Thank you for dedicating your time to read this blog post! I hope you found the information valuable and that it will facilitate your own endeavors. For more articles on reporting and ERP solutions, please visit our blog. If you have any questions or suggestions for future topics to cover, please don't hesitate to reach out to me. I'm always delighted to assist and engage with my readers.