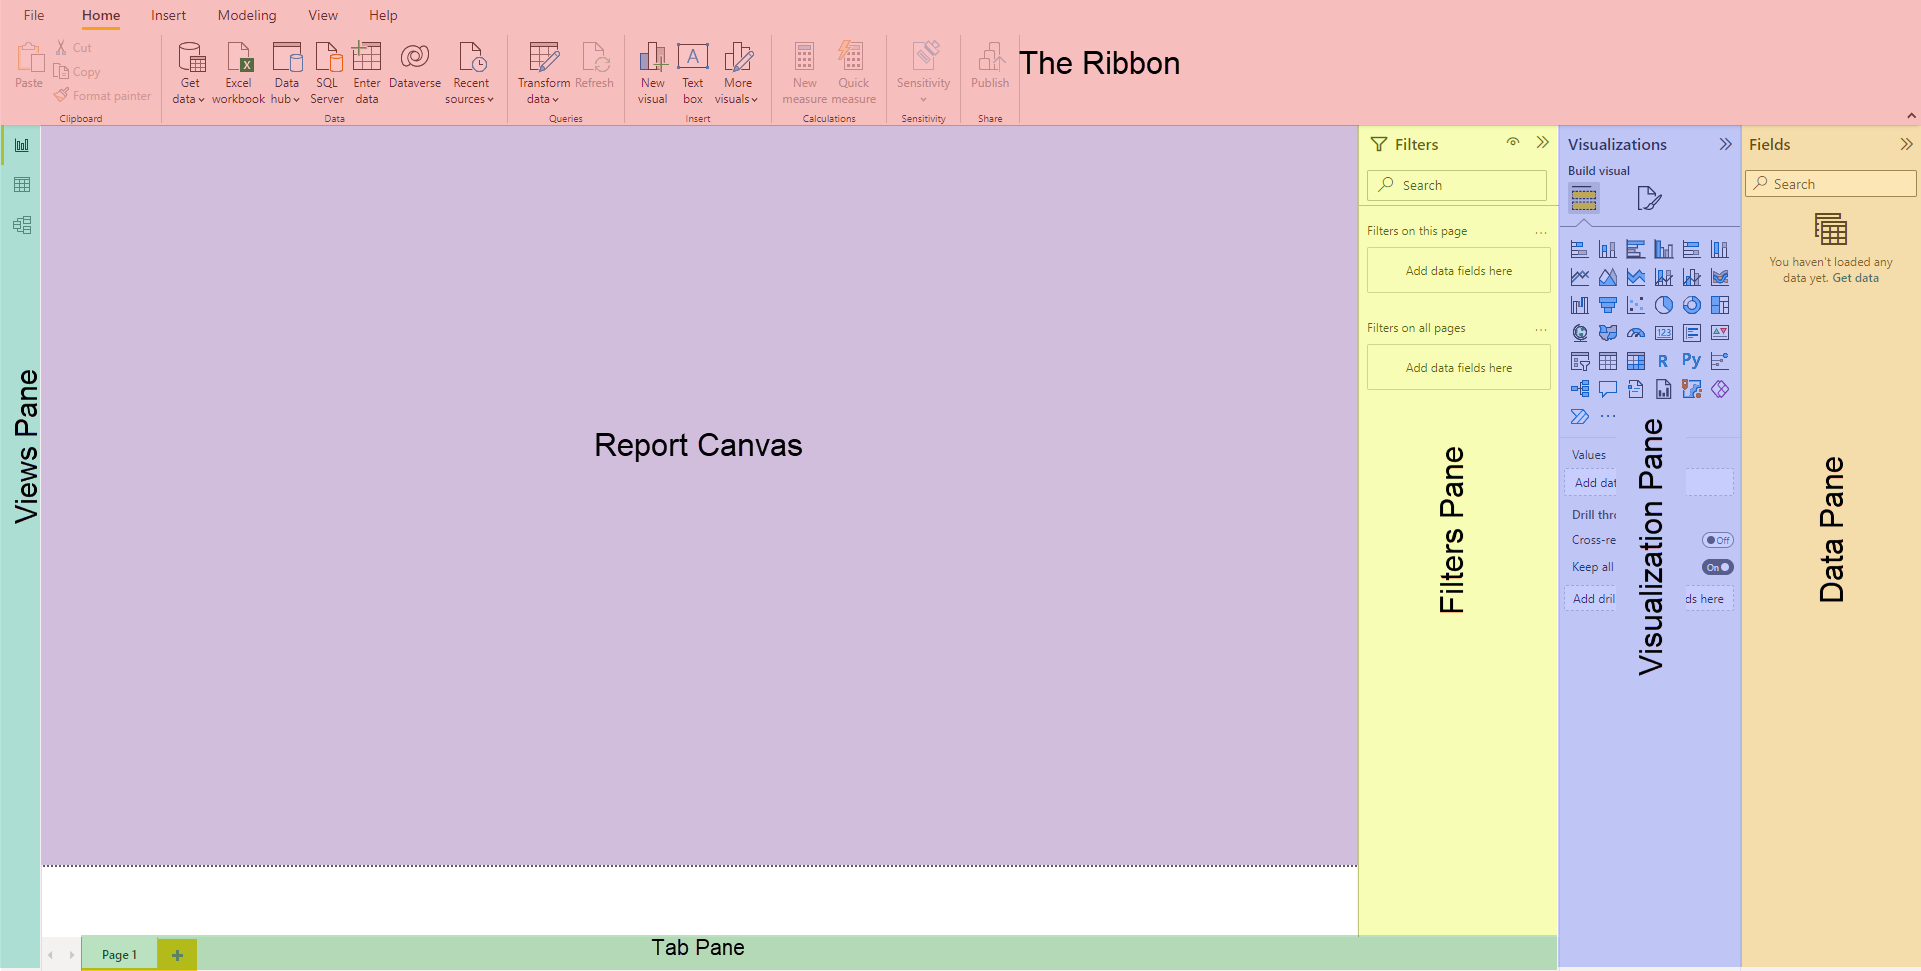
Power BI is built up with a similar layout to Microsoft other products and when you open a power BI desktop session you will have the following 7 modules:
-
The Ribbon
-
View Pane
-
Report Canvas
-
Filter Pane
-
Visualization Pane
-
Data Pane
-
Tab Pane
The Ribbon
The Ribbon is where you can add data sources, transform your data and add specialized visualization that you do not have available in your Visualization pane.
View Pane
The View Pane has three different views the first it the “Report” view, this is the one we see in the picture above and where you create your report. The second is “Data” view here you can see the data in all your tables and do formatting. The third is “Model” view, this is where you create your data model, if you only have one data source or there are no links between the data sources, then this is redundant. However, the model view is essential when working with normalized data, where you need to create the link between tables.
Report Canvas
The Report Canvas is where you design you report, and all your visualizations will be displayed. This is also what the end user sees when they navigate in a published report.
Filters Pane
The Filters Pane is where you can add filters for the page or for all the pages in the document. It could be that you have blank or duplicate data you do not want to display here adding a filter on either page or all page level can be highly beneficial.
Visualization Pane
The Visualization Pane is where you choose the visualizations to use in your report, the data to use with the visualization and format the visualization.
Data Pane
The Data Pane contains your tables, and you can drag and drop fields from the Data Pane to the visualization to populate your visualizations with data. You can also right-click tables to add new fields or measures.
Tab Pane
The Tab Pane contains all the tab or pages of your report, you can use this to navigate between tabs and create new ones. Generally, these should only be for development, when you publish a report all navigation between tabs should be done with Drill through and buttons.
If you want to continue learning have a look to our blog. For more questions contact our experts!