Power BI is one of the biggest and most popular BI tools today and it is a central part of many companies’ business intelligence toolbox. Therefore, it is essential to integrate your ERP solution with your Power BI. This post will explore the method for retrieving D365FO data from Azure Data Lake.
Retrieve the data
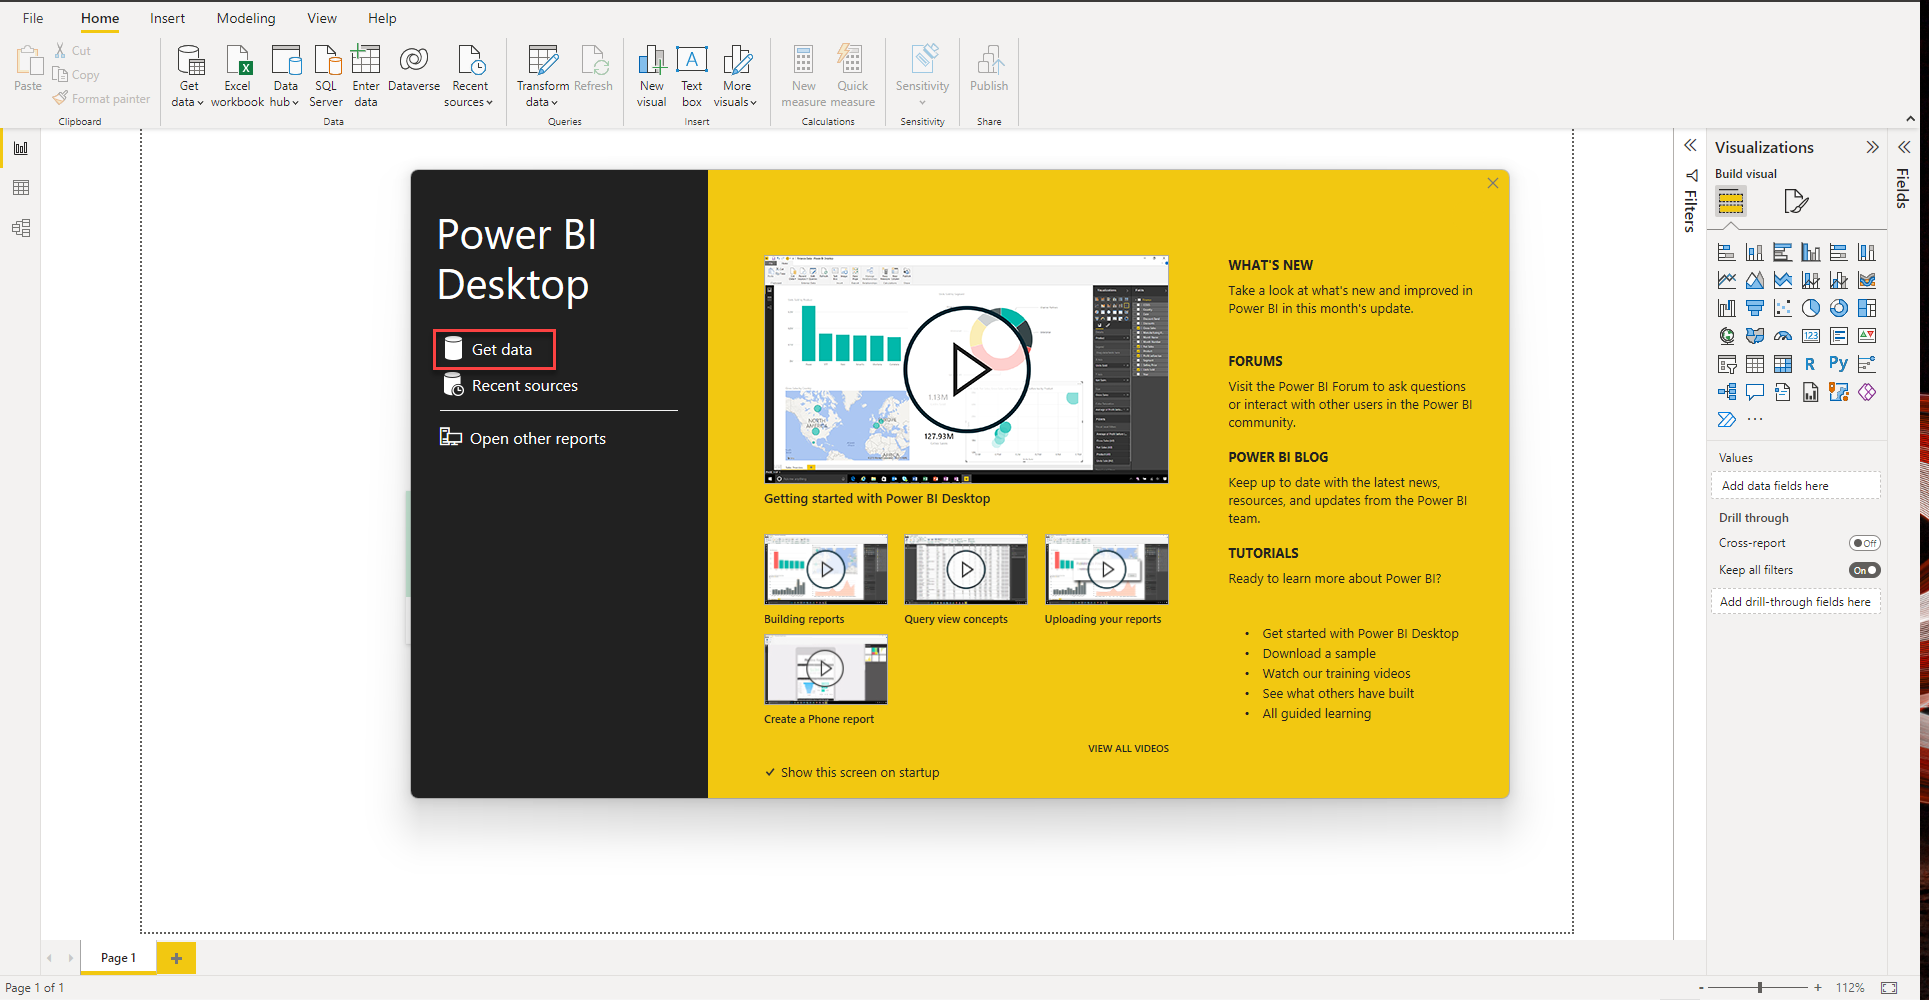
Open a new Power BI session and press “Get Data”.
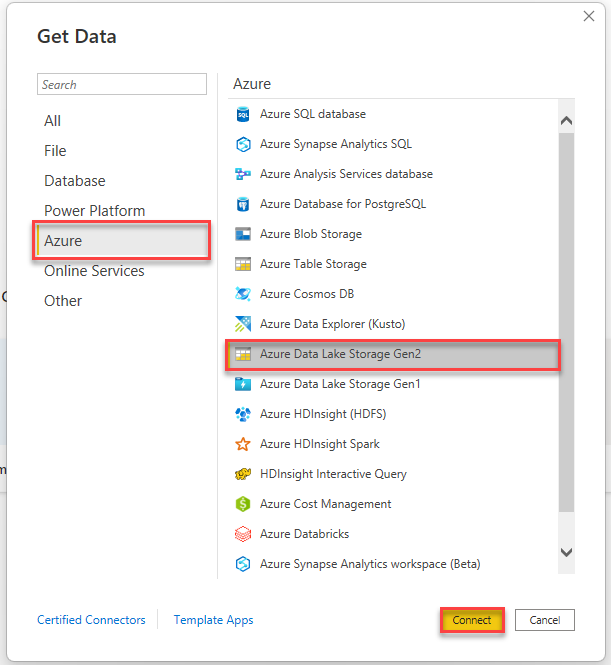
In the pop-up window prompting you to select your data source, navigate to Azure in the menu pane and select the Azure Data Lake Storage Gen2 and press connect.
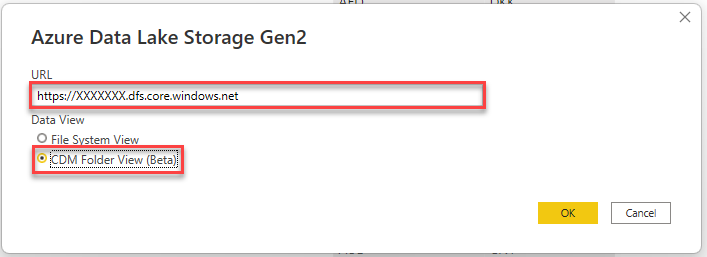
In the popup window asking for an URL enter the data URL e.g., https://XXXXXXX.dfs.core.windows.net, choose to use CDM folder view for the data. Allowing you to see the folder structure in your Azure Data Lake and select the files you want to use. The “File System View” provides a list of JSON and CSV files, which contains the same data and requires more manipulation. If it is your first time connecting you will be asked to authenticate. Here if your Microsoft account has access to the data in Azure data lake, then you can logon with your credentials alternatively you will have to type in the key from Azure.
After connecting to Azure Data Lake and authenticating, you are presented with a new pop-up window, allowing you to navigate to the tables you want to use from your Azure Data Lake.
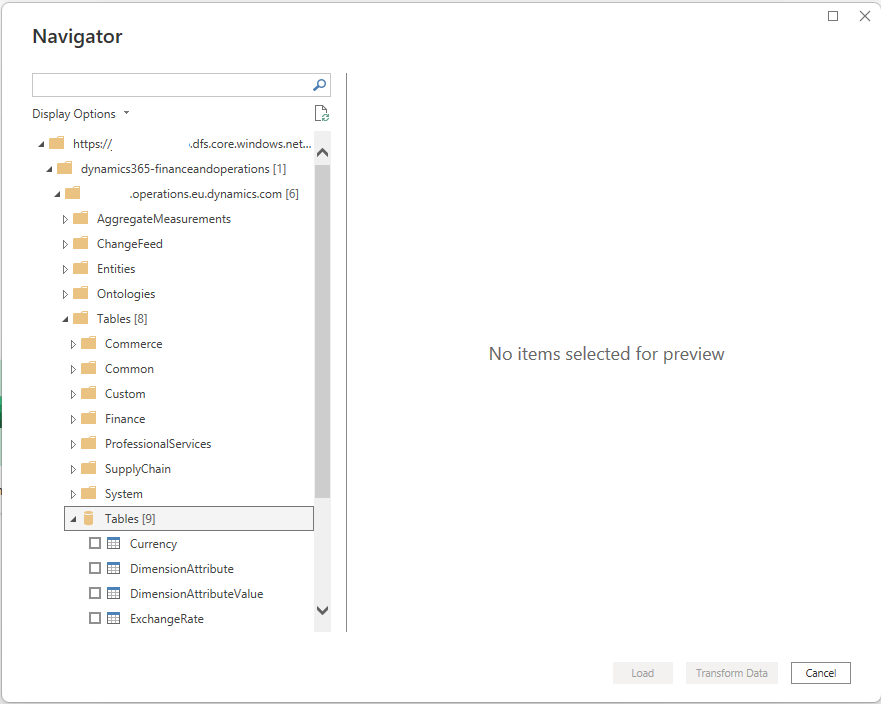
Select the tables to include in your report, it is possible to add or remove tables later. The example for this report is a simple view of Exchange Rates for that the following three tables are needed: Currency, ExchangeRate, ExchangeRateCurrencyPair.
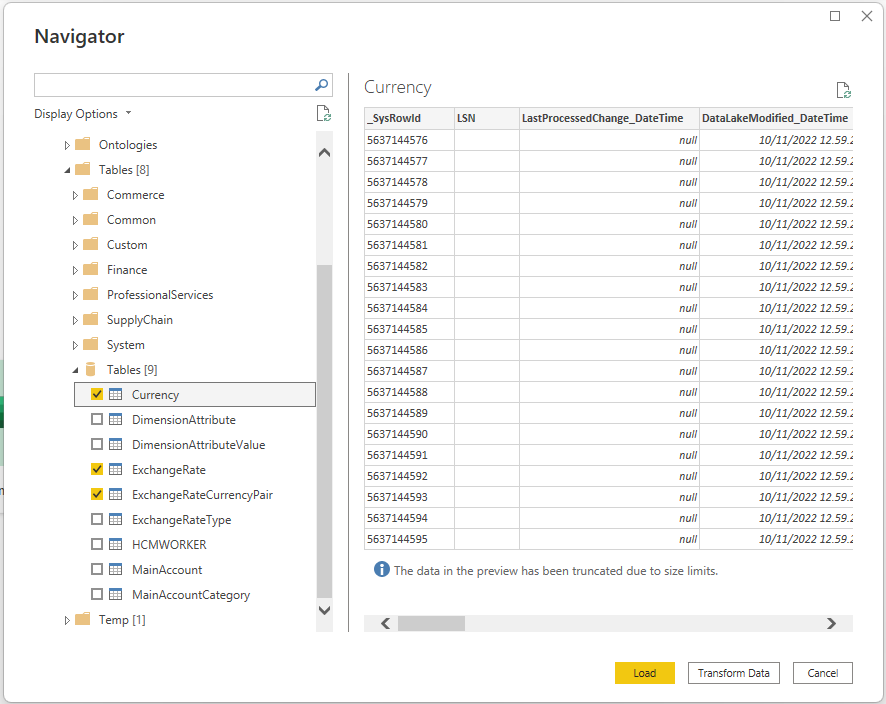
After selecting the data, you can do two things, Load or Transform Data. For this example, we will do a Load since there is no need to transform the data. Transform Data allows you to change data type or do changes to the data (you can always transform it later).
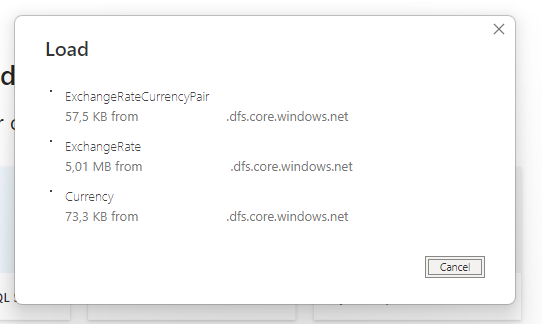
While the data loads you will see the following box, it will also tell you if there are any errors in your load.
Create the Data model
When the load is done, we need to create the data model, ensuring the correct connection between the data sets to enable us to create reports. 
For data model best practices is to have the high hierarchy data in the top and the low hierarchy data in the bottom.
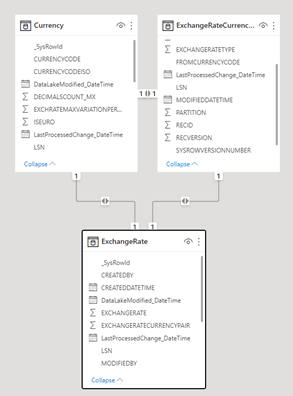
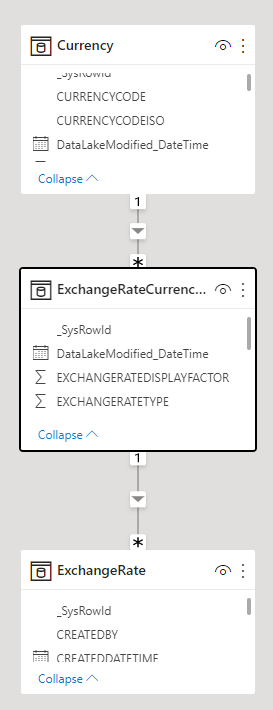
Hovering a connection string the fields creating the connection becomes highlighted. To delete a connection right click on the string and choose “Delete”. Power BI creates connections between data points with the same naming. To create a connection, drag the field from “Table A” to the corresponding field in “Table B”. For the exchange rate example, create the following connections: RECID from ExchangeRateCurrencyPair with EXCHANGERATECURRENCYPAIR in ExchangeRate. For currency there is more possible connections for the example CurrencyCode from Currency and FromCurrencyCode in ExchangeRateCurrencyPair is used. Allowing you to show more details on the currencies.
Visualize the Data
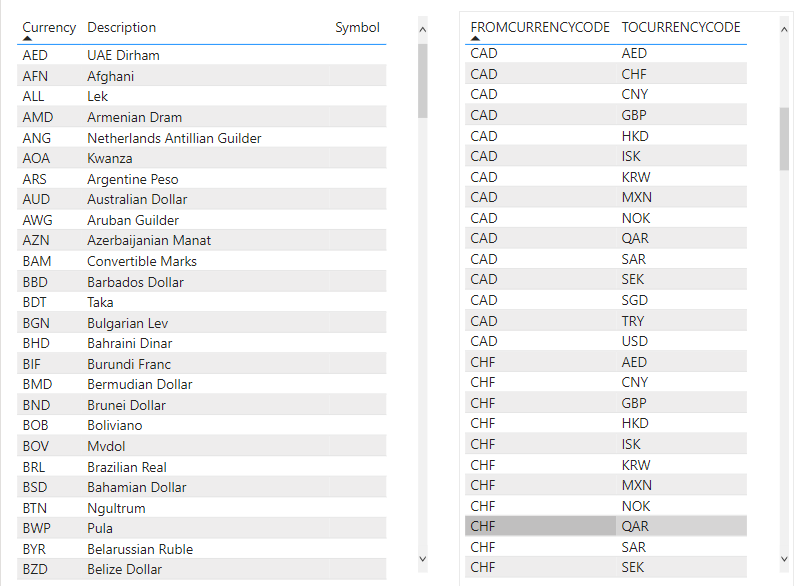
To visualize the data, we will make a simple report with an overview tab and a details tab. First, add a table and populate it with the following field from Currency:
- CURRENCYCODE
- TXT
- SYMBOL
In another table add the following fields from ExchangeRateCurrencyPairs
- FROMCURRENCYCODE
- TOCURRENCYCODE
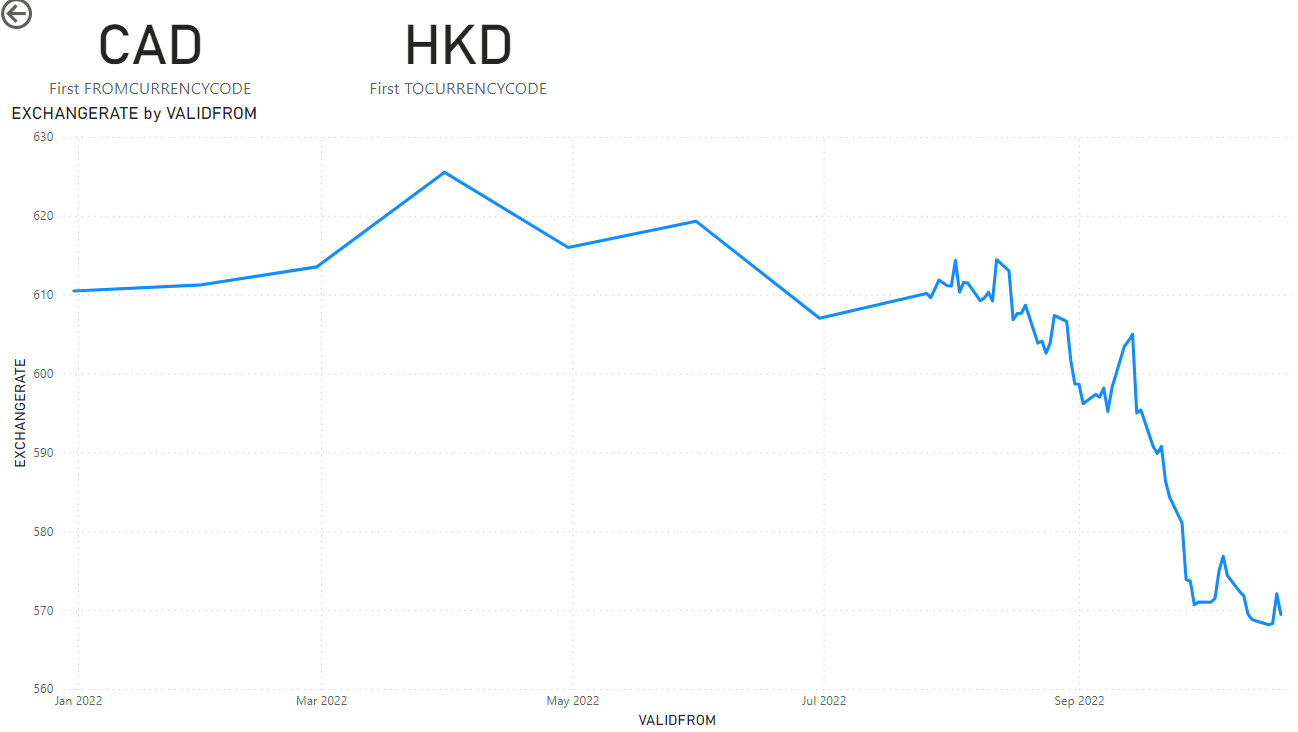
In a new tab make a graph with the following information:
- VALIDFROM on the x-Axis
- EXCHANGERATE on the y-axis
- Drill through
- FROMCURRENCYCODE
- TOCURRENCYCODE
Add two Cards with:
- FROMCURRENCYCODE
- TOCURRENCYCODE
Now you have a report with an overview tab with drilldown capabilities.
If you right-click any of the FROMCURRENCYCODE or TOCURRENCYCODE you have the option to Drill through to the detail page with the graphical representation.
This concludes the post on how to create a Power BI report with D365FO data from Azure Data Lake. The purpose of this post was to give an introduction of how to connect to Azure Data Lake. Load a couple of tables and connect them together enabling us to produce a meaningful report from the 3 tables.
If you have questions or are interested in learning more, please do not hesitate to contact us.