Web scraping and using data from the internet open a whole new aspect of analysis. This open the option for adding real time data to your reports, web-based data sources can be either APIs or source code for a webpage.
The process for working with web-based data sources in Power BI has been made very easy and straight forward. Finding a good site to scrap is however getting more and more difficult. Sites with data directly display, often hides it behind embedded Java Script pages.
When looking at a page to scrape you should first research if:
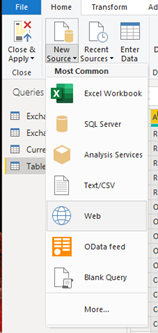
The page has an API, and if so if it needs a token to authenticate, some APIs are completely open and all you need is an URL to scrape the information. If the page does not have an API, then you can either check the source code for how the webpage is structured, or copy paste the URL into a Web-based data source in power BI.
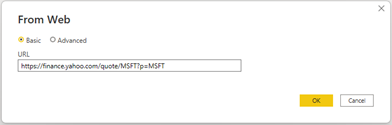
This is to get summary of Microsoft from Yahoo finance, I choose this example because it may not immediately give you the data, due to cookie consent. The URL used here is https://finance.yahoo.com/quote/MSFT?p=MSFT. When it has loaded you most likely get the following selection options:
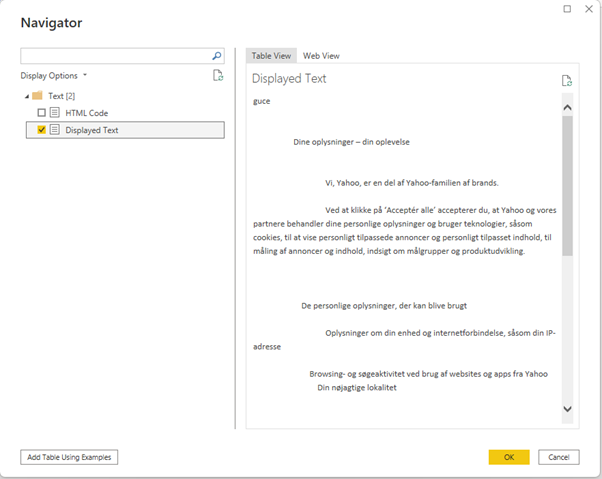
If you do not see any table option, then click the Displayed Text to see what is actually received by the query. For this example I received the text that I need to accept cookies. You may be able to parse the cookies through header parameters, however for this example you do not have to.
Instead load the Displayed text and go to transform data. Then go to the Change pane (Query Settings) and select the source step. In the Formula Area you most like have a formula like:
= Web.BrowserContents("https://finance.yahoo.com/quote/MSFT?p=MSFT")
We have to change this to:
= Web.Page(Web.Contents("https://finance.yahoo.com/quote/MSFT?p=MSFT"))
Now when the data query runs again it should return the following table:
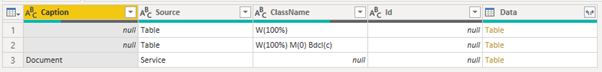
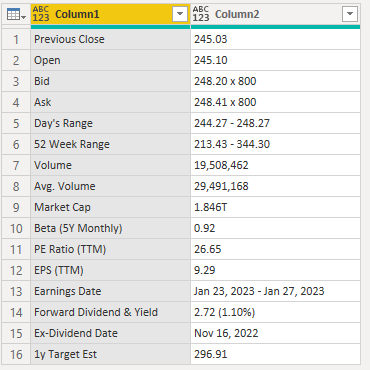
Add a filter on Source to only show “Table” and delete all other columns than data. Leaving you with one column with to rows for data. Expand these by pressing the icon with 2 arrows in the right side of the column header, in the pop up press “OK“. Now you should be left with a similar looking table:
We also want to include historical data for this we can navigate to the historical data tab in Yahoo finance, right click the download button and copy link. This will provide us with a link looking like:
This link use unix epoch formatted datetimes, it is the number of seconds counting from the 1st of January 1970.
You have the option to change interval between Daily (1d), Weekly (1wk), Monthly (1mo).
Finally, whether you want to include Adjusted Close. After updating the query according to you need, we will do as before and add a new Web-based data source.
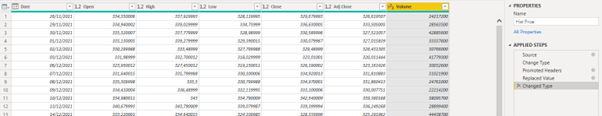
This load only needs limited formatting, and maybe none depending on the numbering format you use in your application. I deleted the format created by Power BI and made a new to make the table look accordingly:
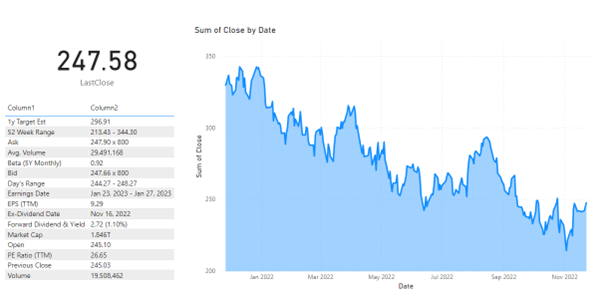
Now we can make a very simple report with a summary table of financial information for Microsoft, a graph showing the Historical price development and a card showing the last close price:
This concludes first part of this post on using web-based data sources to get data into you Power BI report, next we will look at API calls, the core process does not differ greatly, however some aspects of API calls are very different from what we have done here. That said the URL logic used in Yahoo Finance is very similar to what you would see in most API URLs.
I hope this has been valuable, please contact me if you have any questions.
Important: Continuation follows in part 2, don't miss it and enjoy learning!!