
Welcome back to a new Reporting Tuesday blog post, in this post we will explore how to combine multiple web sources to one dataset in Power query. This is exciting because it allows you to mark comprehensive datasets using web sources. Enjoy!
In this blog post we are going to look at how to make a dataset in excel power query that combines data from multiple web sources. For this specifically we will look at how to get data from several stocks into excel and return it to one table.
Here when we talk about a web source, we refer to a source of data that can be accessed over the internet using a web browser or a programming language. Web sources can include websites, databases, and other online resources that provide data in a structured format, such as HTML, XML, or JSON. For this we will make a list of stocks to track and retrieve the data from yahoo finance.
First, we need to open a new excel document, and make a table with the following column headers: Ticker name, From, To, Interval, URL_hist, URL_summary and months of data. These will be used to collect data, and with proper setup you only need to fill in the ticker and the rest is done by formulars.
This is how we will fill in the table:
-
Add the Ticker MSFT for Microsoft in the ticker column.
-
Add the following formula to “From”
![]()
G2 contains the number of months we want to see data for. We subtract the date 1970-01-01 from our “From” date and multiply with 86400 to get the date in Unix epoch format.
-
Add the following formula to “To”
![]()
-
In Interval type 1d
-
In URL_hist add the following formula:
![]()
-
In URL_summary add the following formula:
![]()
-
In months of data add the number of months you want to get data for.
Convert the range to a table and now you should have a table looking like this:
![]()
Now add the tickers you want on your list.
Go to the data tab and in the Get & Transform Data section select from Table/Range.
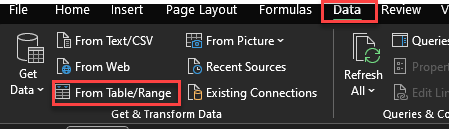
This creates a data source in power query with the information in our table, we will need this to call the web sources.
Create a new data source from other sources and choose blank query.
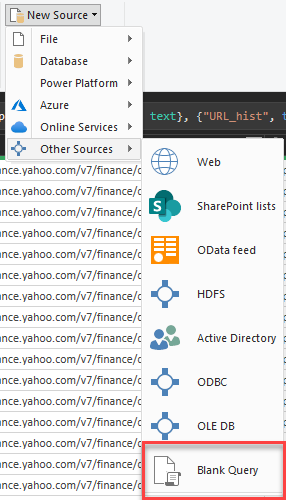
In this blank query go to advanced editor and type in the following code:
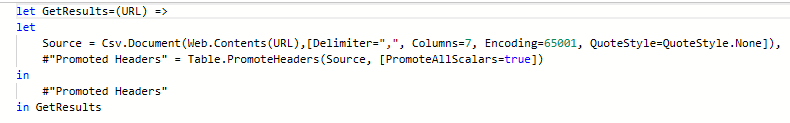
This generates a function that takes a URL and returns a dataset for historical prices. Name this query Historical data Function.
Create 2 more functions: Summary data_1 function and Summary data_2 function. These have the same code structure, however on the fourth line we have Data0 = Source{0}[Data], this must be updated for Summary data_2 function, so 0 becomes 1.
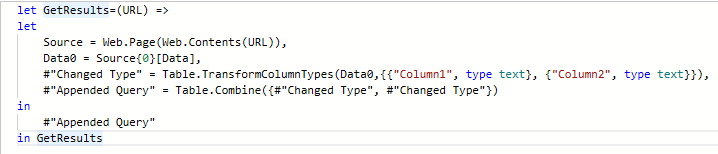
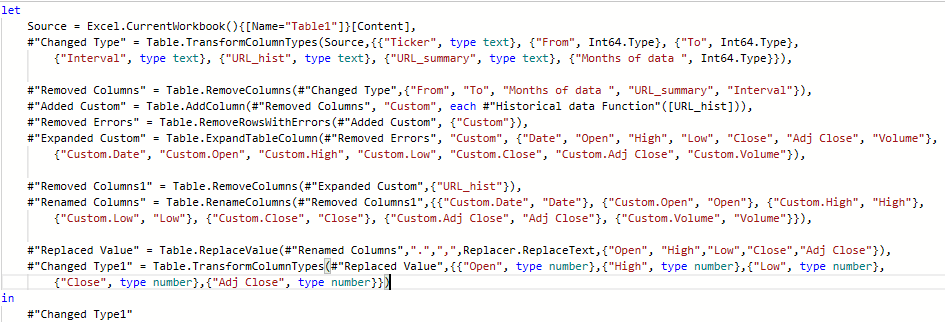
Now we have 3 functions, these we need to combine with our data tables. To do this go to the dataset for the table we created. For historical Data we will add the following code to the Advanced editor:
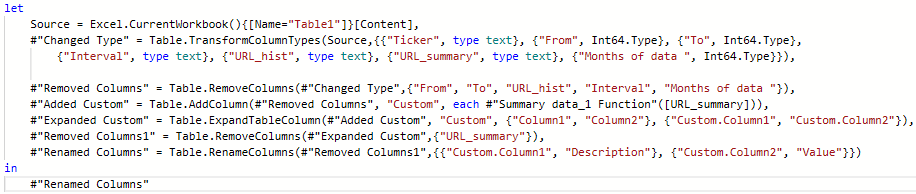
We need to make 2 more datasets with the following code, however, make sure that one calls “Summary data_1 Function” and the other calls “Summary data_2 Function”.
Now for a final step in the query editor go to one of the 2 summary data tables. In the combine section in the ribbon expand Append Queries and select append queries as New. Select the two summary tables.
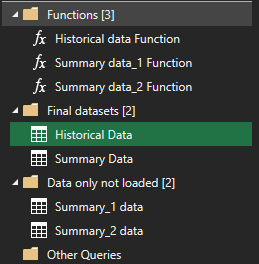
Now you should have the following queries in your query editor:
You can close and load the editor now.
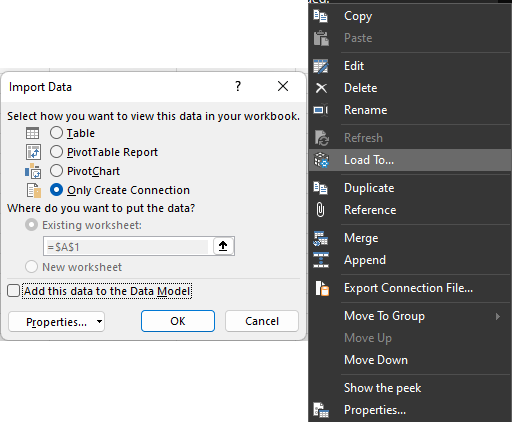
Open the queries and connections pane and right click the summary_1 data, press “load to…”, and select “Only Create Connection”.
Repeat this step for summary_2 data and now the excel is ready to be used. I order to refresh the data, go to the data tab in the ribbon and press refresh all.
To add a new stock to the dataset, you must add the ticker to your table in the ticker column and the rest of the table should autofill.
Now we need to add the data source to power BI we do this by adding a data source of the type excel workbook.
The method we used here can also be applied directly in Power BI. You still have the ticker table in excel and then you preform the data import and manipulation in the Power Query Editor in Power BI instead of in Excel.
This concludes our quick introduction and tutorial on adding multiple web sources to one dataset in Power BI. Thank you for taking time to read this blog post! I hope you found the information useful and that it will help you in your own endeavors. For more articles on reporting and ERP solutions, check out our blog. If you have any questions or suggestions on what to cover next, please don't hesitate to reach out to me. I'm always happy to help and engage with my readers.